SPC Demystified
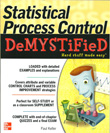
This SPC training material by Quality America president Paul Keller explains how to use statistical process control (SPC) to enable data-driven decision making and gain a competitive advantage in the marketplace. Statistical Process Control Demystified is written in a step-by-step format and provides detailed instructions on how to collect and analyze process data to determine the suitability of a process in meeting requirements. Attribute and variable control charts are discussed. You'll also get details on process improvement and measurement systems analysis. Detailed examples, calculations, and statistical assumptions make it easy to understand the material, and end-of-chapter quizzes and a final exam help reinforce key concepts.
- Complete instruction on interpretation of statistical control charts
- Learn how to overcome common errors in the use of SPC and general statistical analysis tools
- Understand sampling requirements and other fundamental assumptions
- See how regression analysis and designed experiments are used for process improvement
- Discover the methods for measurement systems analysis, including R&R studies
- Learn the limitations of some common continuous process improvement strategies
Sample Excerpts
Preface
Welcome to the exciting world of statistical process control! I am very pleased to write this book, as I have had passion for the subject for many years. I was first introduced to SPC over 25 years ago, as a graduate student intern at a leading computer products manufacturer. Although I had a bachelor's degree in engineering, and had worked for several years in industry, I had not been exposed to this particular type of statistical analysis. The manufacturing engineers I worked with had only limited experience, and together we persevered our way through implementing control charts on a key process. Along the way, we made what I later determined were several fundamental errors. We learned the hard way that our process suffered from issues that hadn't been discussed in our textbook examples.
Other Excerpts in our online Knowledge Center
Population versus Process Statistics
SPC Subgroup Formation Concerns
I took these hard lessons back to graduate school and learned as much as I could on the techniques. I applied them myself as a quality director in a couple of manufacturing organizations. In the early 1990s, I had the chance to become the technical services director for a company that developed SPC software. In that capacity I oversaw the technical support group, working with customers as they implemented SPC in a wide variety of industries including healthcare, aviation, banking, insurance, chemical processing and manufacturing. Our customers had seemingly varied needs; in reality there were many common threads. As much as each industry felt theirs was unique, in fact they had much in common. As might be expected, the tools of SPC have application across many types of processes, with only subtle differences in use.
As I write these pages, I am now president and chief operating officer of the company. Over the past 20 years I have applied these tools internally to our key processes, to learn, improve, and predict the dynamics of our internal sales and support processes, as well as our marketing and product development efforts. SPC is an integral part of what we do, and how we remain competitive in a sometimes crowded market. It provides the fundamental backbone to our systems, to consistently meet the needs of a demanding yet appreciative audience of quality professionals. I am indebted to many of these clients, who over the years have shared their problems and experiences with me, through their technical support issues, sales inquiries or training sessions. I feel quite fortunate to have worked with so many professionals who work diligently to service their customers and seek the truth that only data can provide. I have tried to encapsulate as much of their collective experiences in this book as possible.
Examples are provided throughout this book from a wide variety of applications, including general service (or transactional) processes, healthcare process, chemical processing and manufacturing. The books' topics build on each other, so it is recommended to read each chapter in the order provided. There are a number of critical and fundamental concepts discussed in earlier chapters that are required for later chapters.
Calculations and statistical assumptions are provided as needed, with emphasis on chart application and interpretation. Examples are provided for each chart, which may be downloaded from the author's Web site at www.qualityamerica.com/downloads/SPCDemystified.htm. Given the commercial availability of inexpensive SPC software, students are expected to use statistical software to quickly calculate the statistics and draw the chart. A time-restricted license of an easy to use MS Excel add-on for SPC is available for free via the above link for users of this textbook. This commercially-available SPC software package has been confidently used by thousands of organizations worldwide to quickly perform SPC analysis.
This text may be used for training groups of SPC practitioners within an organization, or for self-study to master the tools and methodology of statistical process control.
I hope you enjoy it and have the opportunity to realize the full potential of these powerful tools.
Table of Contents
Chapter 1 Analyzing Process Data
Chapter Objectives
The Application of Statistics to Processes
A Process Defined
Population versus Process Statistics
Statistical Process Control Concepts
Requirements versus Control
Control Chart Interpretation
Reaction to Special Cause Variation
Interpretation Relative to Requirements
Summary
Quiz
Chapter 2 Data Collection
Chapter Objectives
Data Properties
Metrics
Business-Level Metrics
Operational and Process Metrics
Chart Selection
Sampling Requirements
Rational Subgroups
Subgroup Size Considerations
Frequency of Subgroup Collection
Number of Subgroups Needed
Summary
Quiz
Chapter 3 Determining Suitability to Requirements
Chapter Objectives
Overview
Capability Indices Assuming Normality of Process Data
Cp for Bilateral Specifications
Cpk Index for Bilateral or Unilateral Specifications
Interpretation
Estimating Process Variation
Errors in Estimating Process Capability
Identifying Non-Normality in Process Data
Capability Estimates for Non-Normal Processes
Process Performance Indices
Summary
Quiz
Chapter 4 Attribute Control Charts
Chapter Objectives
Description and Use
The p Chart
The Np Chart
The u chart
The c chart
Interpretation
Sampling Considerations
Summary
Quiz
Chapter 5 X Charts
Chapter Objectives
Chart Construction
Sigma Chart
Interpretation
Process Shift Example
Subgroup Formation Concerns
Multistream Processes
Autocorrelated Processes
Short Run Applications
Summary
Quiz
Chapter 6 Charts for Individuals Data
Chapter Objectives
Description and Use
Moving Average Charts
Exponentially Weighted Moving Average (EWMA) Charts
Process Capability and Distributional Assessment
Individual X Charts
Example X Chart Application in Asthma Care
Summary
Quiz
Chapter 7 Process Improvement
Chapter Objectives
Overview
Stratification
Regression Analysis
Residuals Analysis
Multiple Regression
Designed Experiments
Defining the Experiment
Analyzing Experimental Results
Summary
Quiz
Chapter 8 Measurement Systems Analysis
Chapter Objectives
Overview
Stability
Linearity
Repeatability & Reproducibility (R&R)
Range Method of R&R Analysis
Destructive Testing
ANOVA Method
Summary
Quiz
Questions and Examples from Practitioners
Final Exam
Answers to Quizzes & Final Exam
Appendix: Control Chart Constants
References