Quality America Inc.

Contact Info

Email Sales

Log In

Site Search

Menu

Show navigation Hide navigation
  • SPC Software
    • SPC-PC IV Explorer
    • QA-Calibrate
    • SPC IV Excel
    • Green Belt XL
    • My Software
  • Training & Certification
    • Certification Courses
    • Short Courses & Study Guides
    • Instructor Materials
    • Process Excellence Books
    • Knowledge Center
    • My Courses
  • Company
    • About Us
    • Catalog
    • Satisfaction Guarantee
    • Development Process
    • Privacy Policy
    • Contact Us

You are here:

  1. Home
  2. SPC Software
  3. SPC IV Excel
  4. Slideshow
  5. Basing Control Limit on Fixed Values or Subsets of Data

Product Nav

  • Tutorial
  • Step One - Select a Chart
  • Step Two - Organize Your Data
  • Step Three - Options
  • Step Four - Placement
  • Your Finished SPC Chart
  • Displaying Statistics and Other Format Options
  • Filtering your SPC Excel Analysis
  • Removing Subgroups from the SPC Analysis
  • Quickly Display Process Shifts
  • Basing Control Limit on Fixed Values or Subsets of Data
  • Adding Notes to Your SPC Chart
  • Distributing Your SPC Analysis
  • Try SPC IV Excel Yourself

Basing Control Limit on Fixed Values or Subsets of Data

After adding a new region to the chart, selecting a given subgroup in the chart will update the histogram and statistics shown to reflect the selected region. The histogram and statistics shown in the chart below reflect the data in the second region, since the selected subgroup (indicated by the red dot) is in the second region.

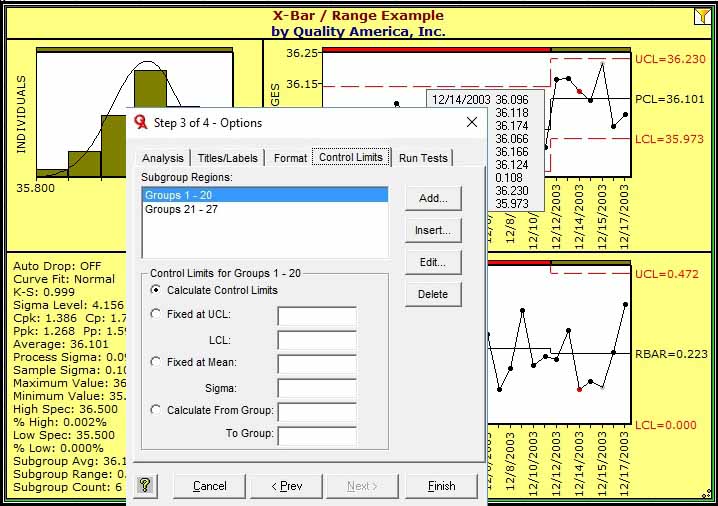
You can select the Options item from the chart's right mouse menu, then the Control Limits tab to review the various methods available for specifying how the control limits are calculated for each region. By default all the groups within the region are used; however in some cases it is desirable to base the limits on an initial sample of 50 subgroups (for example), or to test if the data reflects a process with a stated mean and process sigma. Note that you define each region's control limit method separately. For example, in the dialog box shown below, the calculations are being specified for the region containing subgroups 1 through 40 (since that region is selected in the Subgroup Regions list at the top of the dialog box). To specify the control limits for the second region, containing groups 41-47, select that region from the Subgroup Regions list.

You can also use the Edit button to the right of the Subgroup Regions list to edit the groups included in the region. (Note that regions must be continuous). Use the Delete button to remove the selected region from the chart; use the Add button to create a new region, which produces the same effect as described earlier by grabbing the subgroups using the mouse button in the chart window.

Set SPC chart control limits based on fixed values  or historical data
« Previous
Up
Next »

Since 1982: The art & science to improve your bottom line

Quality America offers Statistical Process Control software, as well as training materials for Lean Six Sigma, Quality Management and SPC. We embrace a customer-driven approach, and lead in many software innovations, continually seeking ways to provide our customers with the best and most affordable solutions. Leaders in their field, Quality America has provided software and training products and services to tens of thousands of companies worldwide.

More//

Menu

  • SPC Software
    • SPC-PC IV Explorer
    • QA-Calibrate
    • SPC IV Excel
    • Green Belt XL
  • Training & Certification
    • Certification Courses
    • Instructor Materials
    • Short Courses & Study Guides
    • Process Excellence Books
    • Knowledge Center
    • My courses
  • Company
    • About Us
    • Satisfaction Guarantee
    • Development Process
    • Privacy Policy
    • Terms & Conditions
    • Contacts


sales@qualityamerica.com
Linked-In page

Copyright © 2025 Quality America Inc.
Quality America Inc.