Step Two - Organize Your Data
Select your data source and its orientation in the worksheet. Note the software supports a wide variety of formats for the data within the spreadsheet. Detailed instructions are provided for each chart type in the Help system.
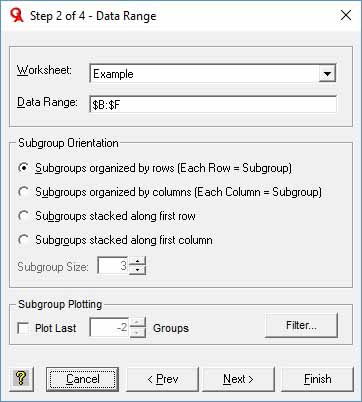
In this case, we've conveniently selected the columns B through F in the Excel spreadsheet, and the wizard populates the text box entry with our selection. Although we could have selected specific cells, such as $B$2:$F$48, by selecting an entire column the chart will automatically update when new data is added within the column. The chart automatically excludes the textual data in row 1 from the plotted data.
The options provided in the Subgroup Orientation section are dependent on the chart type selected in Step 1. In the simple case of an Individual-X chart, where the subgroup size is one, there are no options for orientation, since the data range will be specified as a single row or column. For subgrouped data (n>1) used in the X-Bar chart, there are four options provided:
Subgroups organized by row (Each Row = Subgroup): Select this option if a single subgroup is contained in each row, with the observations for the subgroup spread across the columns. For example, for 2 subgroups of size 3:
|
A |
B |
C |
|
|
1 |
Subgroup 1, Observation 1 |
Subgroup 1, Observation 2 |
Subgroup 1, Observation 3 |
|
2 |
Subgroup 2, Observation 1 |
Subgroup 2, Observation 2 |
Subgroup 2, Observation 3 |
Subgroups organized by column (Each Column = Subgroup): Select this option if a single subgroup is contained in each column, with the observations for the subgroup spread down the rows.For example, for 2 subgroups of size 3:
|
|
A |
B |
|
1 |
Subgroup 1, Observation 1 |
Subgroup 2, Observation 1 |
|
2 |
Subgroup 1, Observation 2 |
Subgroup 2, Observation 2 |
|
3 |
Subgroup 1, Observation 3 |
Subgroup 2, Observation 3 |
Subgroups stacked along first row: Select this option if the data is contained in a single row specified by the Data Range, with each subgroup to the right of its predecessor. You must also enter the subgroup size into the text box labeled Subgroup Size.
Subgroups stacked along first column: Select this option if the data is contained in a single column specified by the Data Range, with each subgroup below its predecessor. You must also enter the subgroup size into the text box labeled Subgroup Size.
Note that the X-Bar and Range Charts support subgroup sizes from 2 to 10, due to the statistical limitations of the Range statistic for larger subgroup sizes. The X-Bar and Sigma Charts support subgroup sizes from 2 to 32,000.
We will look at the options available in the Subgroup Plotting section later in this tutorial.
Once you've specified the data range and its orientation, select the Next button to advance to Step Three, or use the Finish button to draw the chart using the default options.