P Chart Calculations
Plotted statistic for the P Attribute Control Chart
The percent of items in the sample meeting the criteria of interest
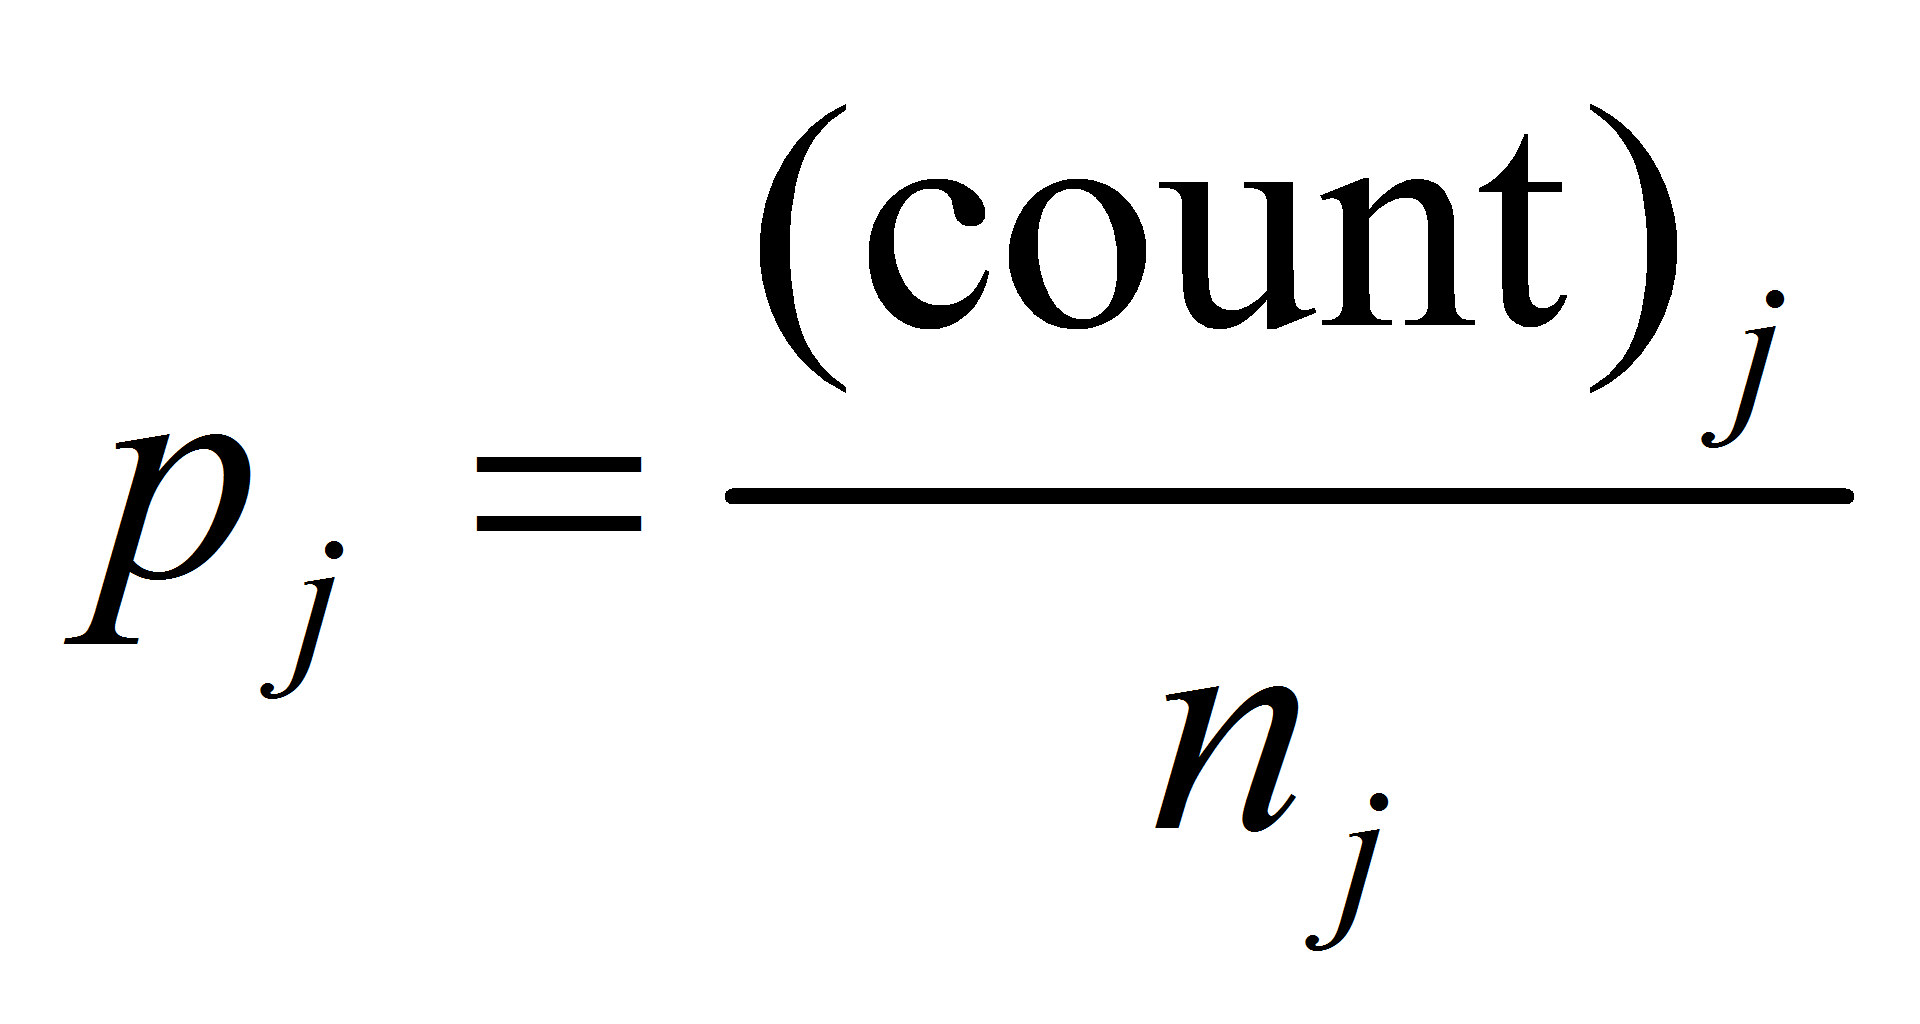
where nj is the sample size (number of units) of group j.
Center Line
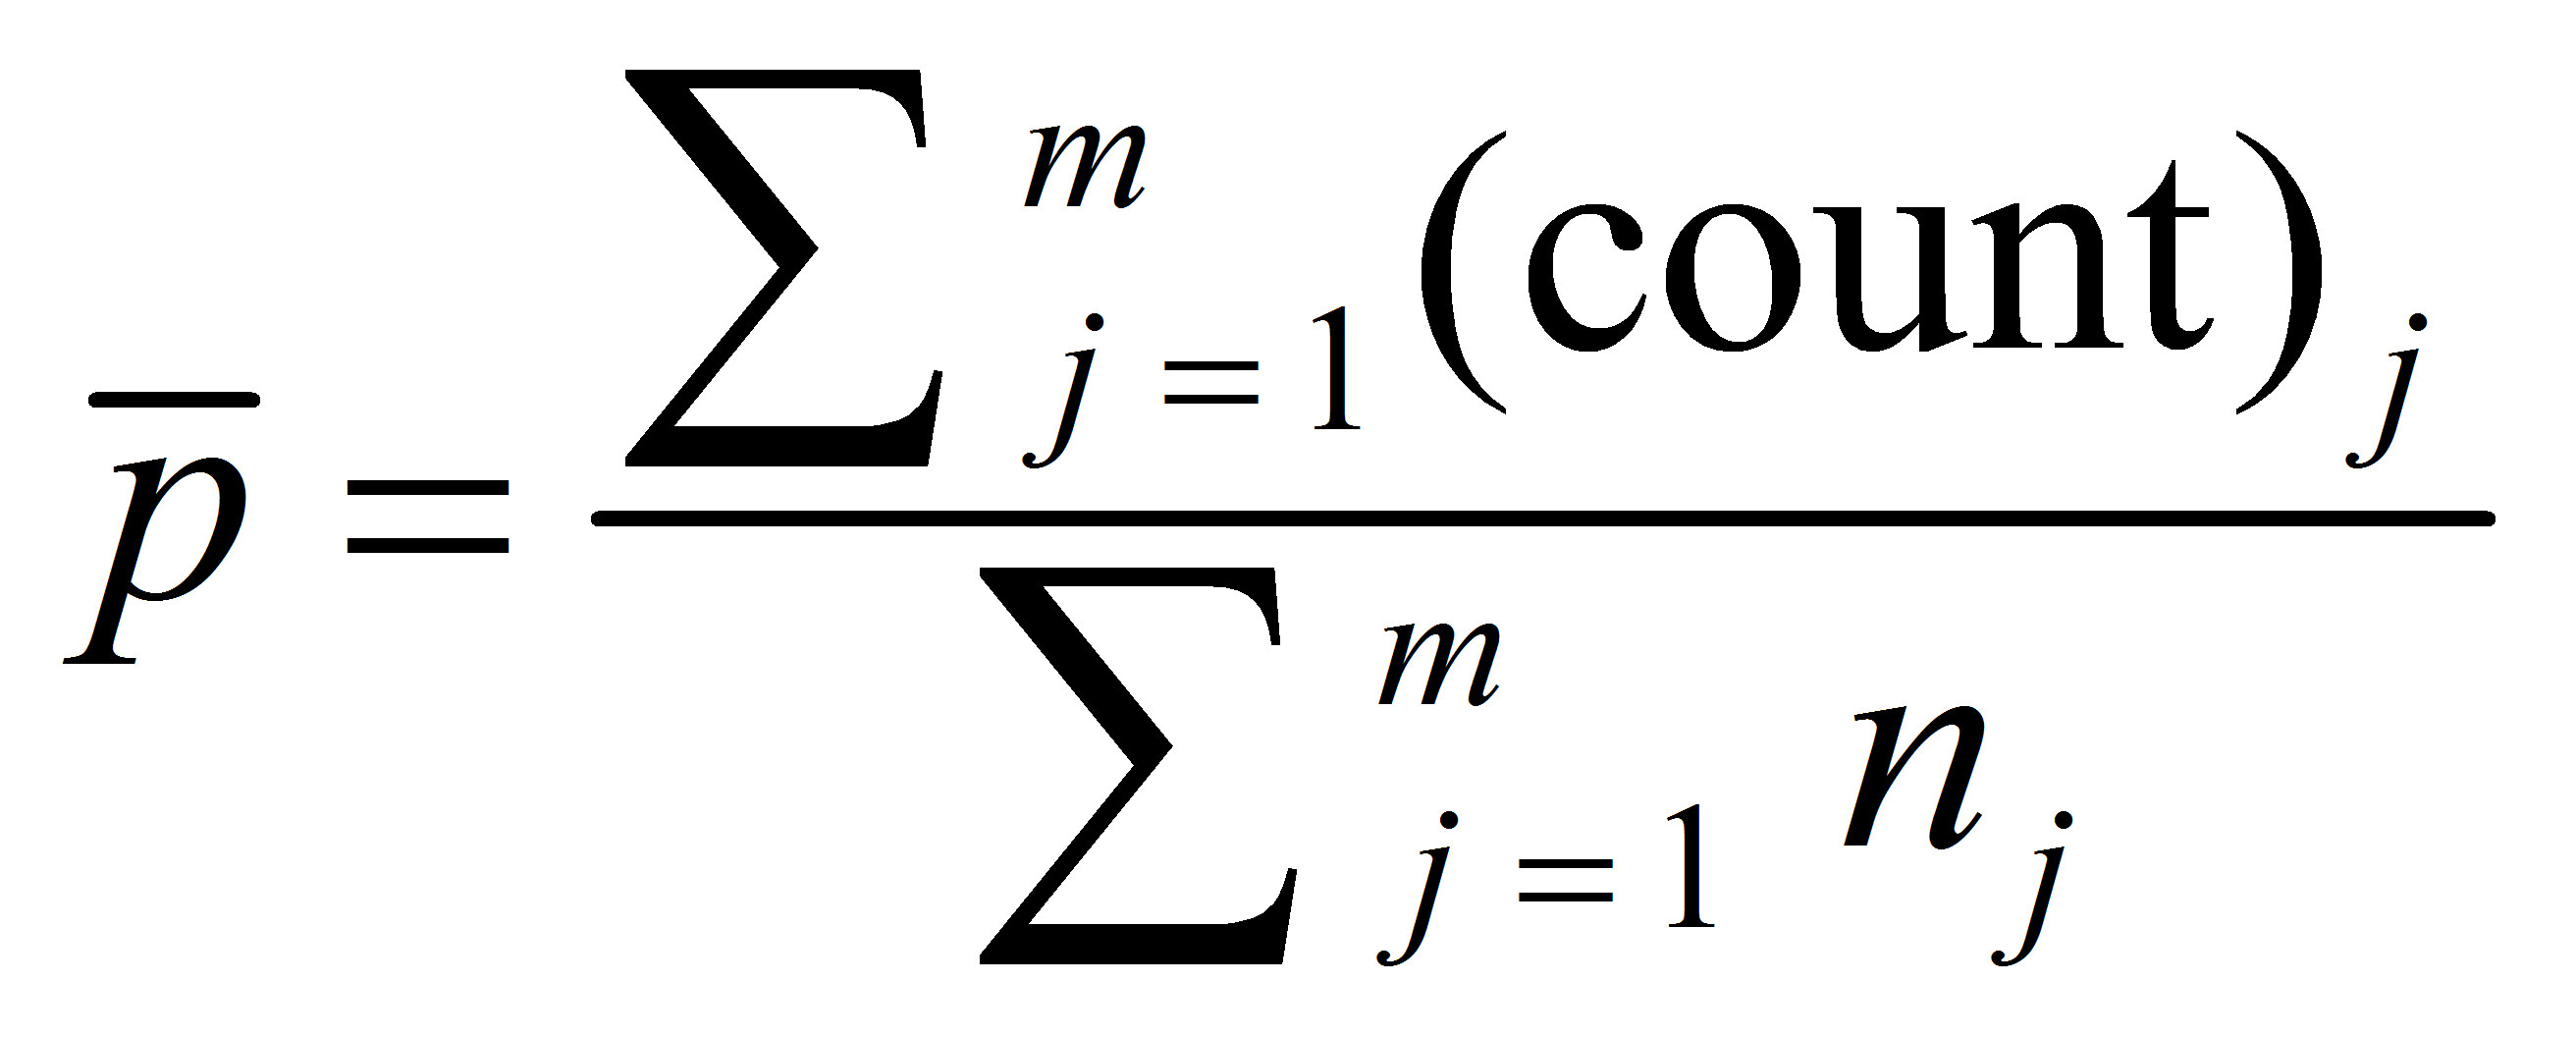
where nj is the sample size (number of units) of group j, and m is the number of groups included in the analysis.
UCL , LCL (Upper and Lower Control Limit)
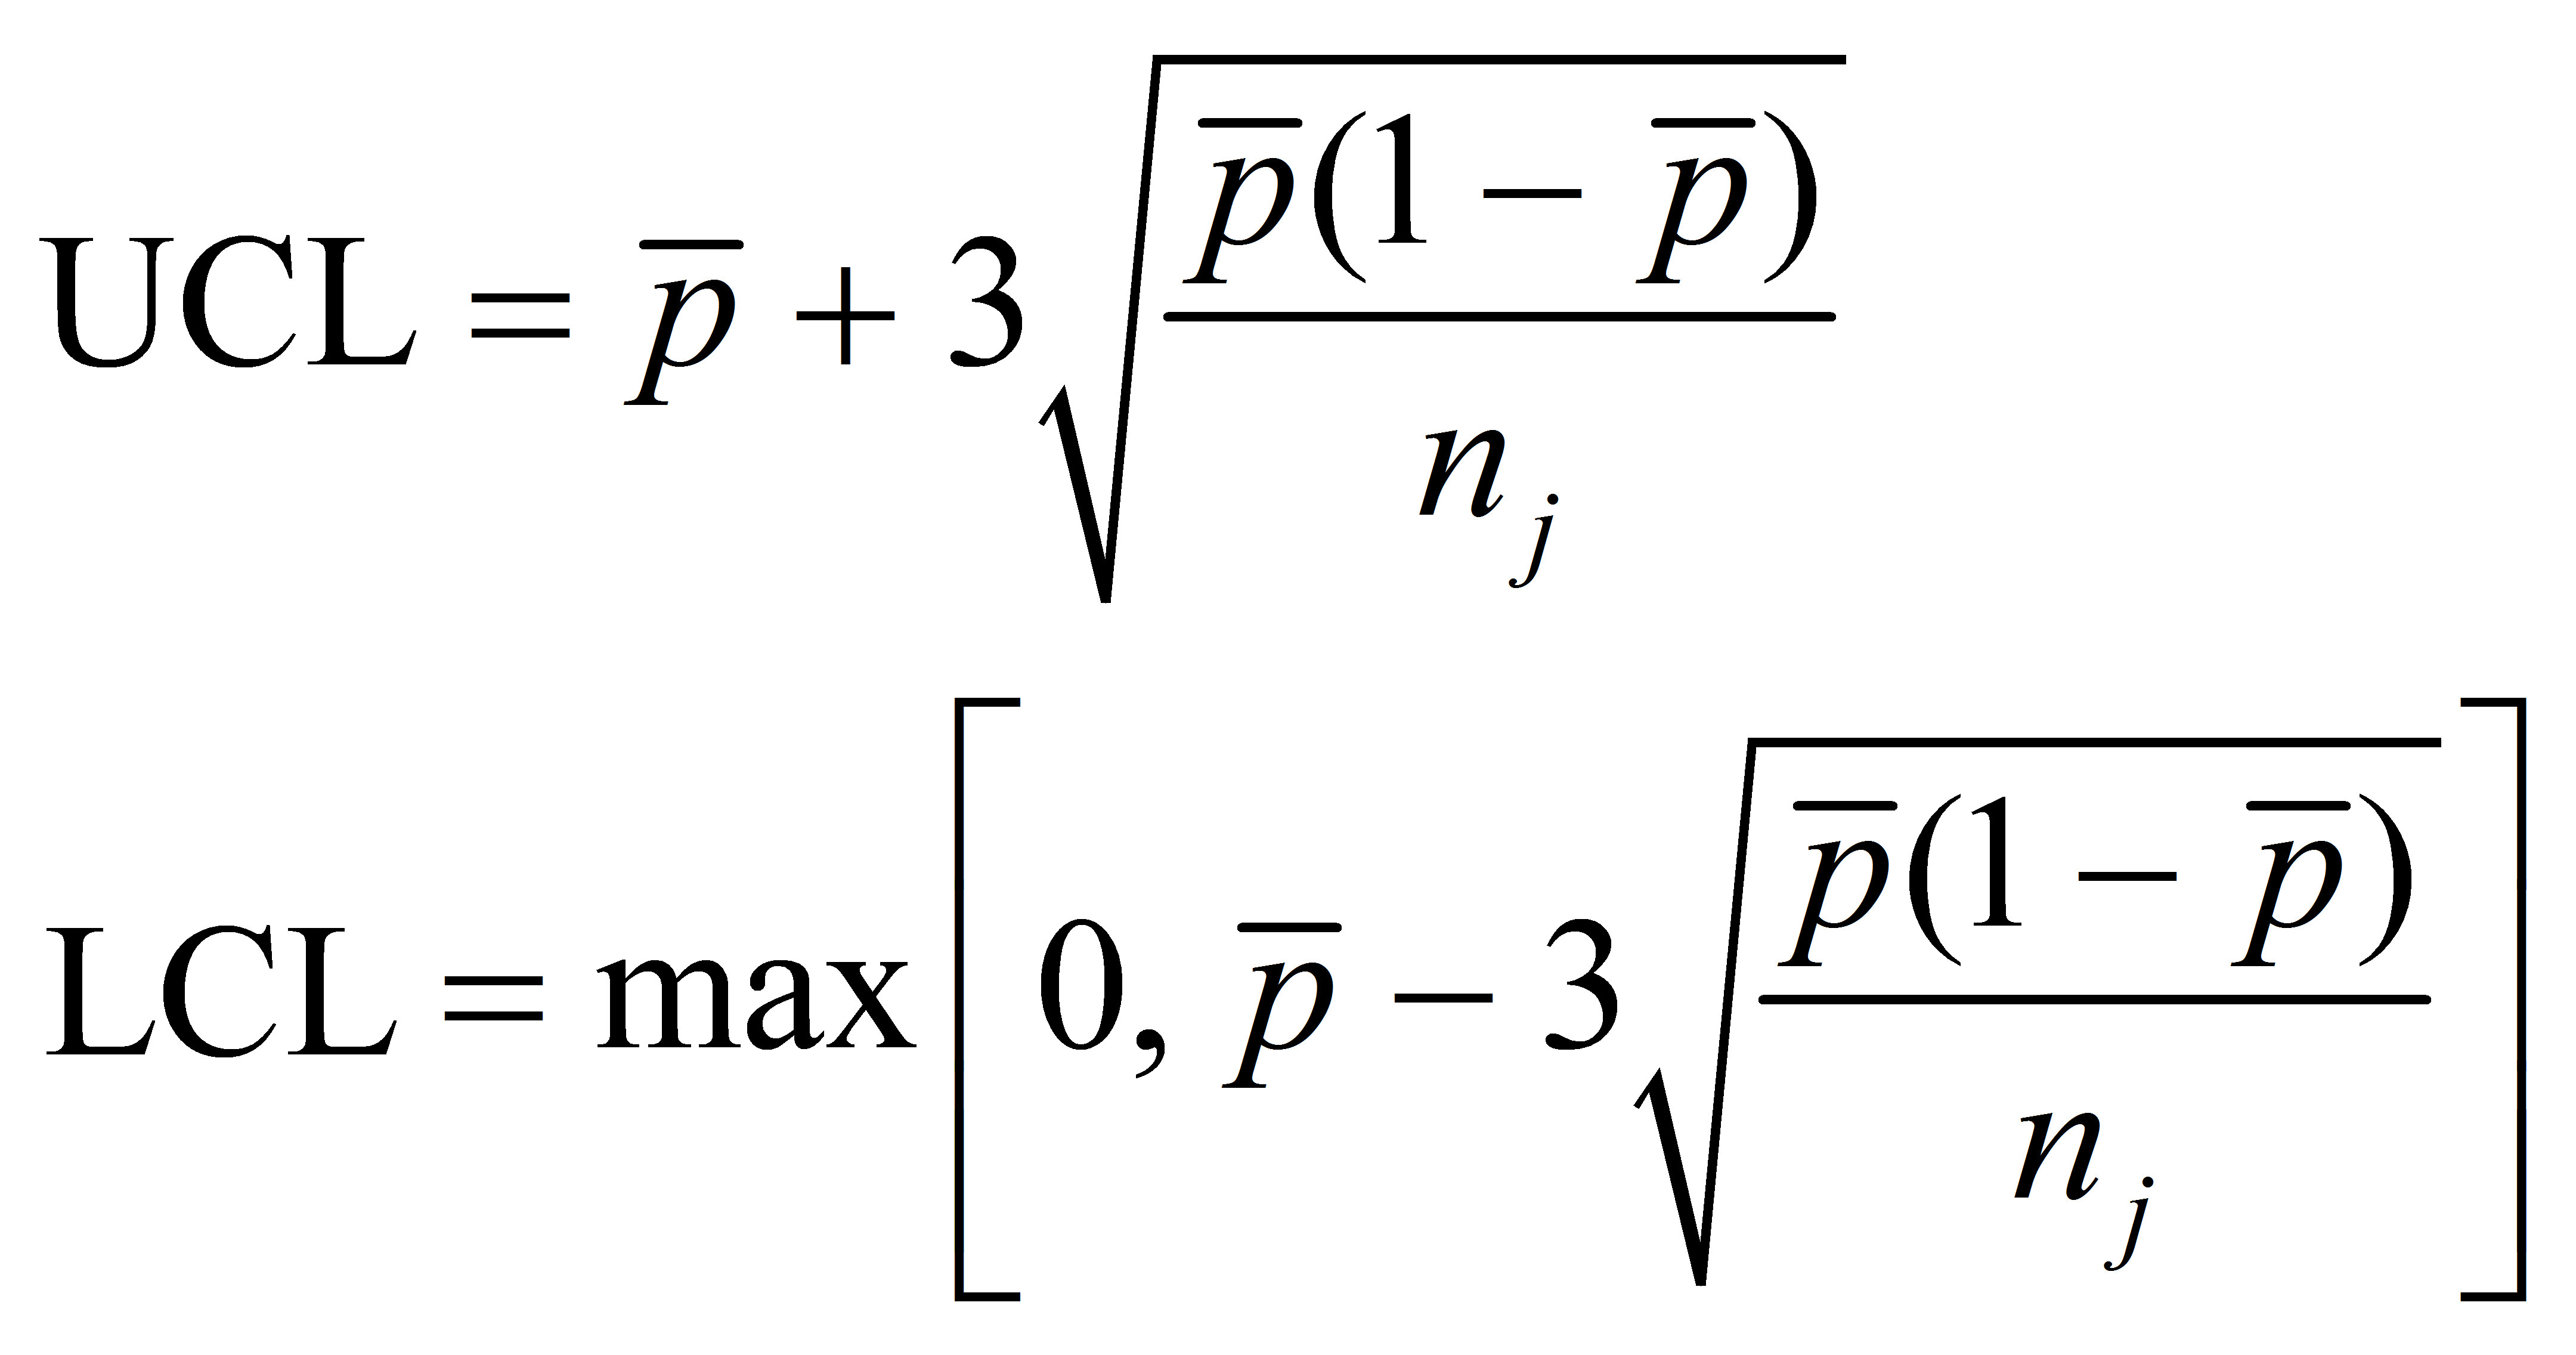
where nj is the sample size (number of units) of group j, p-bar is the Average percent.
The P chart control limits vary for each sample based on its sample size, but are easily calculated using our SPC software.
See also: