Central limit theorem
The following is an excerpt from The Quality Engineering Handbook by Thomas Pyzdek, © QA Publishing, LLC.
The central limit theorem can be stated as follows:
Irrespective of the shape of the distribution of the population or universe, the distribution of average values of samples drawn from that universe will tend toward a normal distribution as the sample size grows without bound.
It can also be shown that the average of sample averages will equal the average of the universe and that the standard deviation of the averages equals the standard deviation of the universe divided by the square root of the sample size. Shewhart performed experiments that showed that small sample sizes were needed to get approximately normal distributions from even wildly non-normal universes. Figure IV.3 was created by Shewhart using samples of four measurements.
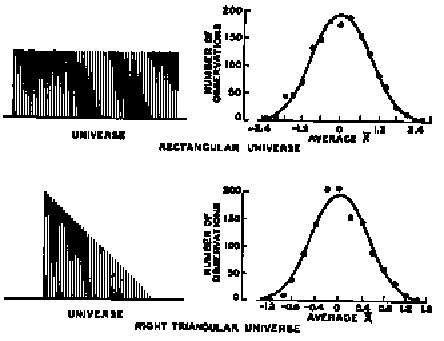
Figure IV.3.Illustration of the central limit theorem.
From Economic Control of Quality of Manufactured Product, figure 59. Copyright © 1980.
Used by permission of the publisher, ASQC Quality Press. Milwaukee, Wisconsin.
The practical implications of the central limit theorem are immense. Consider that without the central limit theorem effects, we would have to develop a separate statistical model for every non-normal distribution encountered in practice. This would be the only way to determine if the system were exhibiting chance variation. Because of the central limit theorem we can use averages of small samples to evaluate any process using the normal distribution. The central limit theorem is the basis for the most powerful of statistical process control tools, Shewhart control charts.